Metrics in marketing: how to make advertising measurable
Metrics are numerical indicators that are used in marketing to evaluate the performance of a company’s actions. To understand what metrics in marketing are, let’s look at their types and roles in analysing a product and project.
In this article, we’ll help you understand what numbers to collect, how to interpret them, and what to look for.
Marketing and product metrics: what’s the difference
Marketing metrics evaluate the effectiveness of marketing campaigns and strategies. They determine how successful a company is at attracting and retaining customers, and what marketing efforts lead to increased sales and profitability. Key marketing metrics are CAC (customer acquisition cost), CR (conversion rate), LTV (customer lifetime value) and ROI (return on marketing investment).
Key product metrics focus on evaluating product performance and utilisation. Based on them, we understand how users interact with it, how useful and convenient it is. Product metrics are user activity, download latency, frequency of use. NPS (customer satisfaction), CRR (customer retention rate), and MAU (unique users) are often considered.
CAC
CAC is not only a funny word, it’s also a number. It stands for Cost of Customer Acquisition – the cost of acquiring new customers.
To determine CAC, add up the costs associated with marketing and divide by the number of customers brought in over a period of time. If a company spent $1000 on advertising and attracted 100 people, the CAC would be $10.
This metric is difficult to rely on – it doesn’t take into account long-tail engagement. A video about the features and benefits of a product can attract customers for years, while a one-off advert in a Telegram channel can take a little over a week, depending on the number of publications. This does not make the metric useless, but it must be used carefully.
CR
Conversion rate is the percentage of website visitors who completed a targeted action, such as making a purchase or leaving a contact. It is the ratio of the number of completed target actions to the total number of visitors. If 1000 people visited the site and 50 people made a purchase, the conversion rate is 5%.
Conversion is a flexible metric that depends on which action is the target action. You can count CR into a purchase from a product card or after a transition from an article or video, registration, subscription to a newsletter – anything.
Let’s say you ordered an advert from a blogger, the video was viewed by 8,000 people, 90 of them went to the site. Divide 90 by 8,000, multiply by 100 and you get a CR of 1.125%. If 5 out of those 90 bought something, we do the same but get 0.062% conversion from video to purchase.
When I worked for an online musical instrument shop, we emphasised getting photo content directly from suppliers instead of filming. As a result, within a year we moved 70% of the content we received to suppliers and reduced the price per customer making a purchase by 12%.
In addition to reducing our own costs, people who knew the product better than us started to be responsible for shooting, which led to an increase in CR – people liked the photos and were more willing to buy.
This process was more difficult to organise than regular shoots – we had to keep more than 10 suppliers in mind at the same time, the stages the product was at, and understand when we could request photos. To organise this, we created a joint board in Task Tracker with the purchasing department. Once a contract was signed, they would add the product to the “Signed” column, then work with the photographers and supplier representatives to arrange the shoot.

In that project, there was a second board that developed shooting guides for the studio and vendors. It included content specialists, analysts, managers and department representatives. As a result, thanks to the guides, we started getting quality and consistent content, which increased CR by 3-12% depending on the department.
CLTV
Customer Lifetime Value (CLTV) is the projected amount of profit a company can get from one customer from the first transaction to the last. To calculate CLTV, multiply the average profit from one customer over a period of time by the average length of co-operation. If a company earns $500 profit per client per year and the average duration of cooperation is 5 years, CLTV equals $2500.
ROI
Return on Investment is an investment performance indicator that measures the profit earned on an investment in proportion to the money invested. ROI is calculated as the difference between profit and invested funds divided by invested funds and multiplied by 100%.
If a company invested $1000 and made $1500 profit, the ROI would be 50%.
Knowing CAC, CR, CLTV, and ROI helps you make informed decisions about budget allocation between marketing channels, as well as plan for profitability and return on investment.
What to do with metrics
Identify the key metrics that most accurately reflect the company’s goals and strategy. Think about what you’re focusing on now – growing your customer base, retaining existing customers, or trying to increase sales per person. Set goals based on that.
Key metrics vary by business model and target market. Goals should be measurable, available to analyse and help inform decisions.
Consider the source of the data – from a counter built into the site to yandex.metrics. We can’t say that one option is better than the others, but it’s important to realise that information differs from source to source due to collection principles, so if you take conversion rates for 2022 from one source and 2023 from another, the results won’t be relevant.
Take into account the settings used to collect the data – store it, protect it and try not to knock it down. Otherwise you’ll have to explain a sudden 200% increase in CR after a price increase. Write them down, memorise them, take a screenshot and forward it to yourself a couple of times.
To collect the right data, we recommend the article (How a marketer should task an analyst).
It is important not only to collect reports, but also to successfully visualise them and set goals based on them. Data are not only indicators of business success, but also planning. Thanks to them, we understand where the company is moving, which sources bring more traffic, which ones should be strengthened – or abandoned as ineffective.
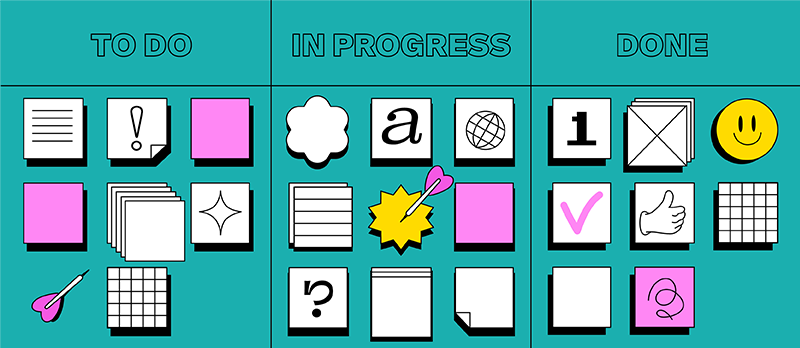
To stay on top of the data and communicate with the team, the MOGU task tracker, which I already showed above in the case study about musical instrument photos, is a good fit.
What the tracker will help with:
- You won’t lose old data – information can be organised into columns and stored so that even new team members can find it.
- You can set precise and detailed tasks for the analyst – with screenshots, checklists and other add-ons.
- Set reminders so you don’t miss deadlines.
- Organise your team.
- You can add comments and clarifications to tasks.
Other news

Agile methodology and its principles
Agile methodology is an approach aimed at flexible workflow management of products and projects, which is often applied in small teams. This...
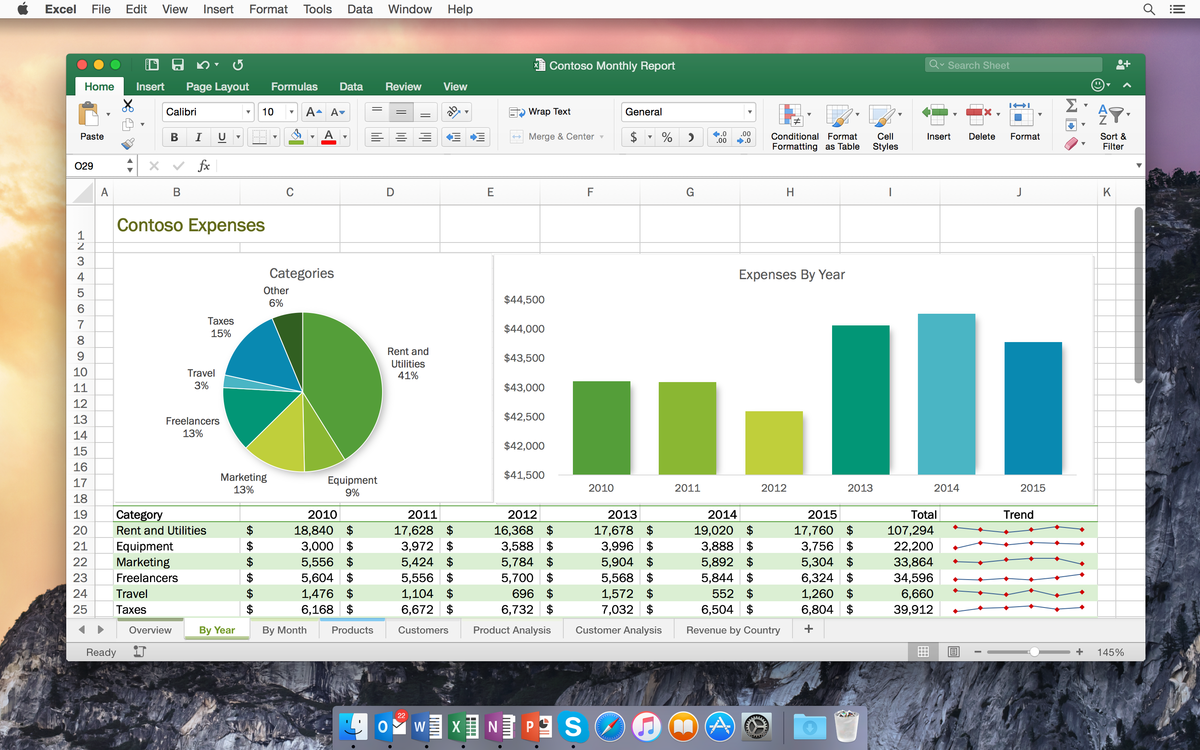
Go beyond Excel for effective project management
Do you know a situation where your team has been maintaining a workspace in Excel or Google Doc for an extended period...
What is Kanban
Kanban is a task and workflow management system that is used in various fields, especially often in digital teams. The main goal...